NBC News
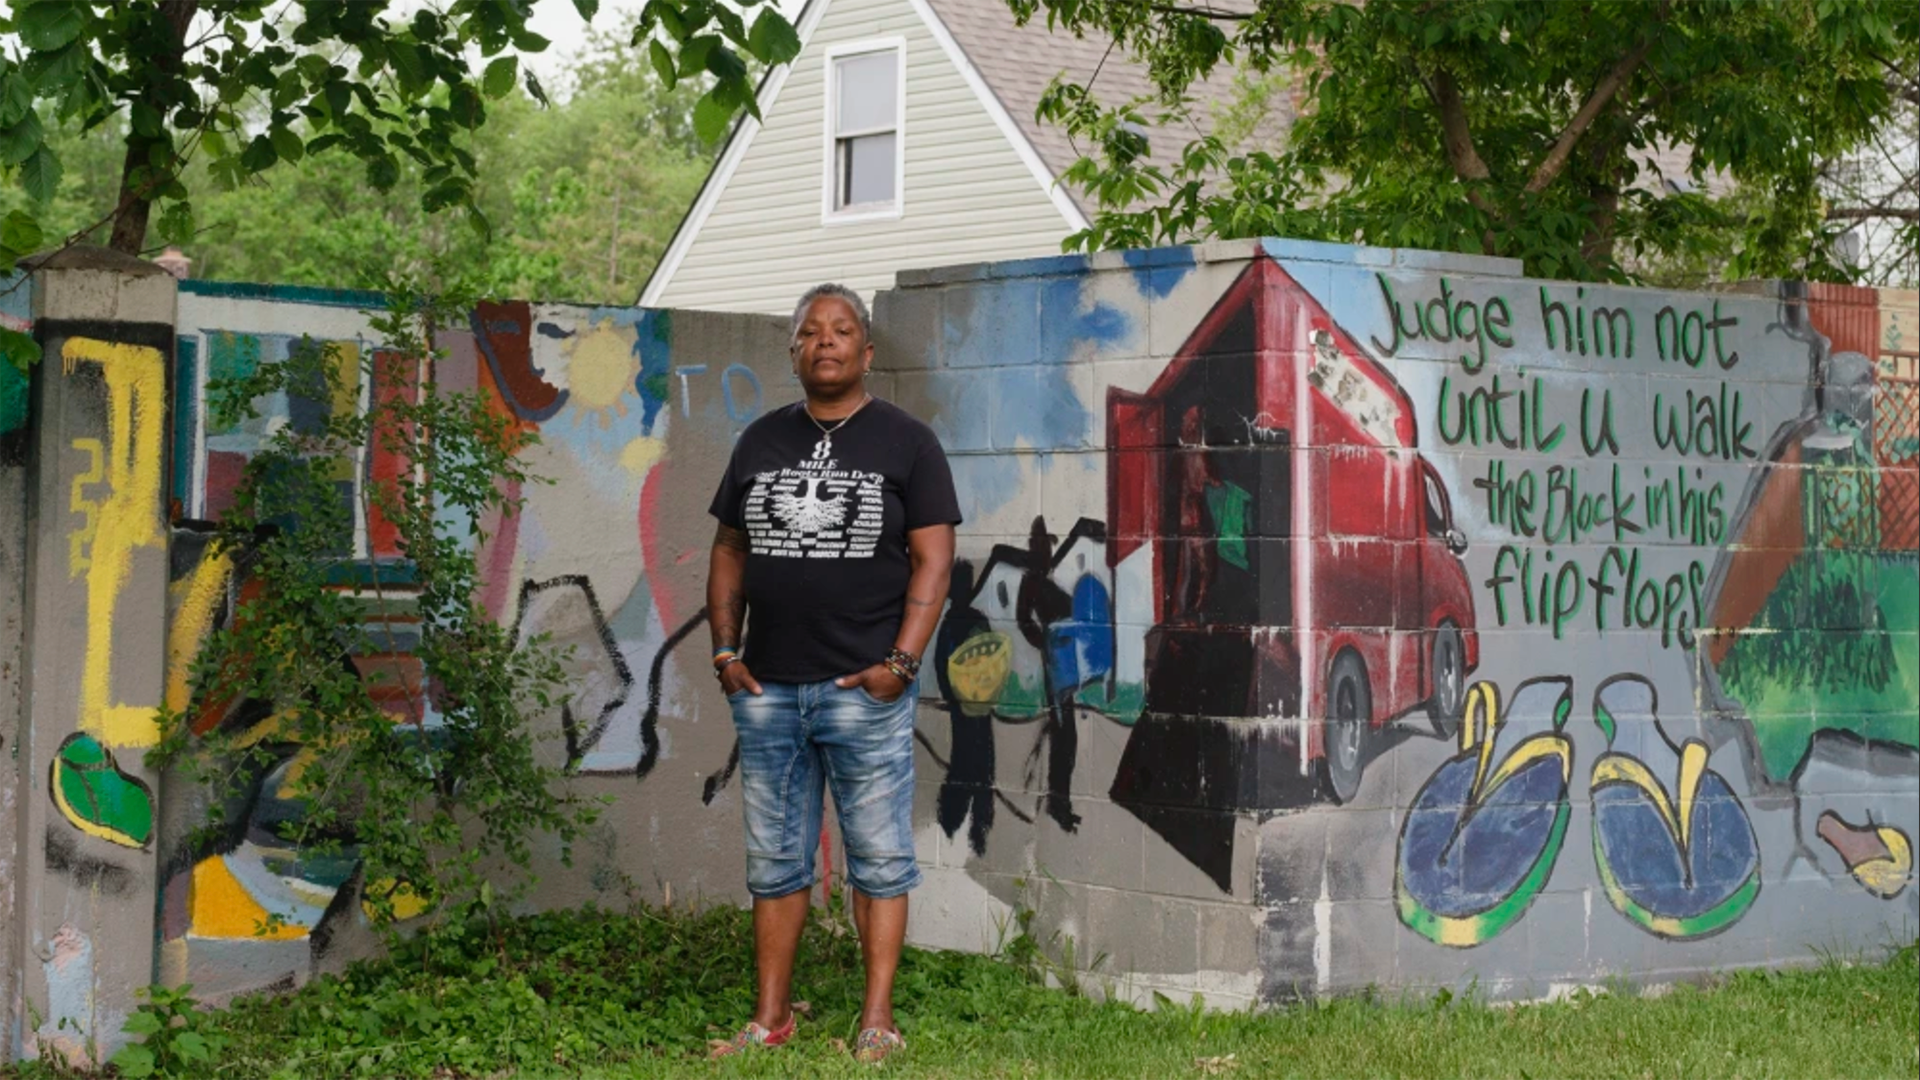
Built to
Built to
keep Black
from white
Best Individual Editorial Feature - Media Company /
Webby Winner
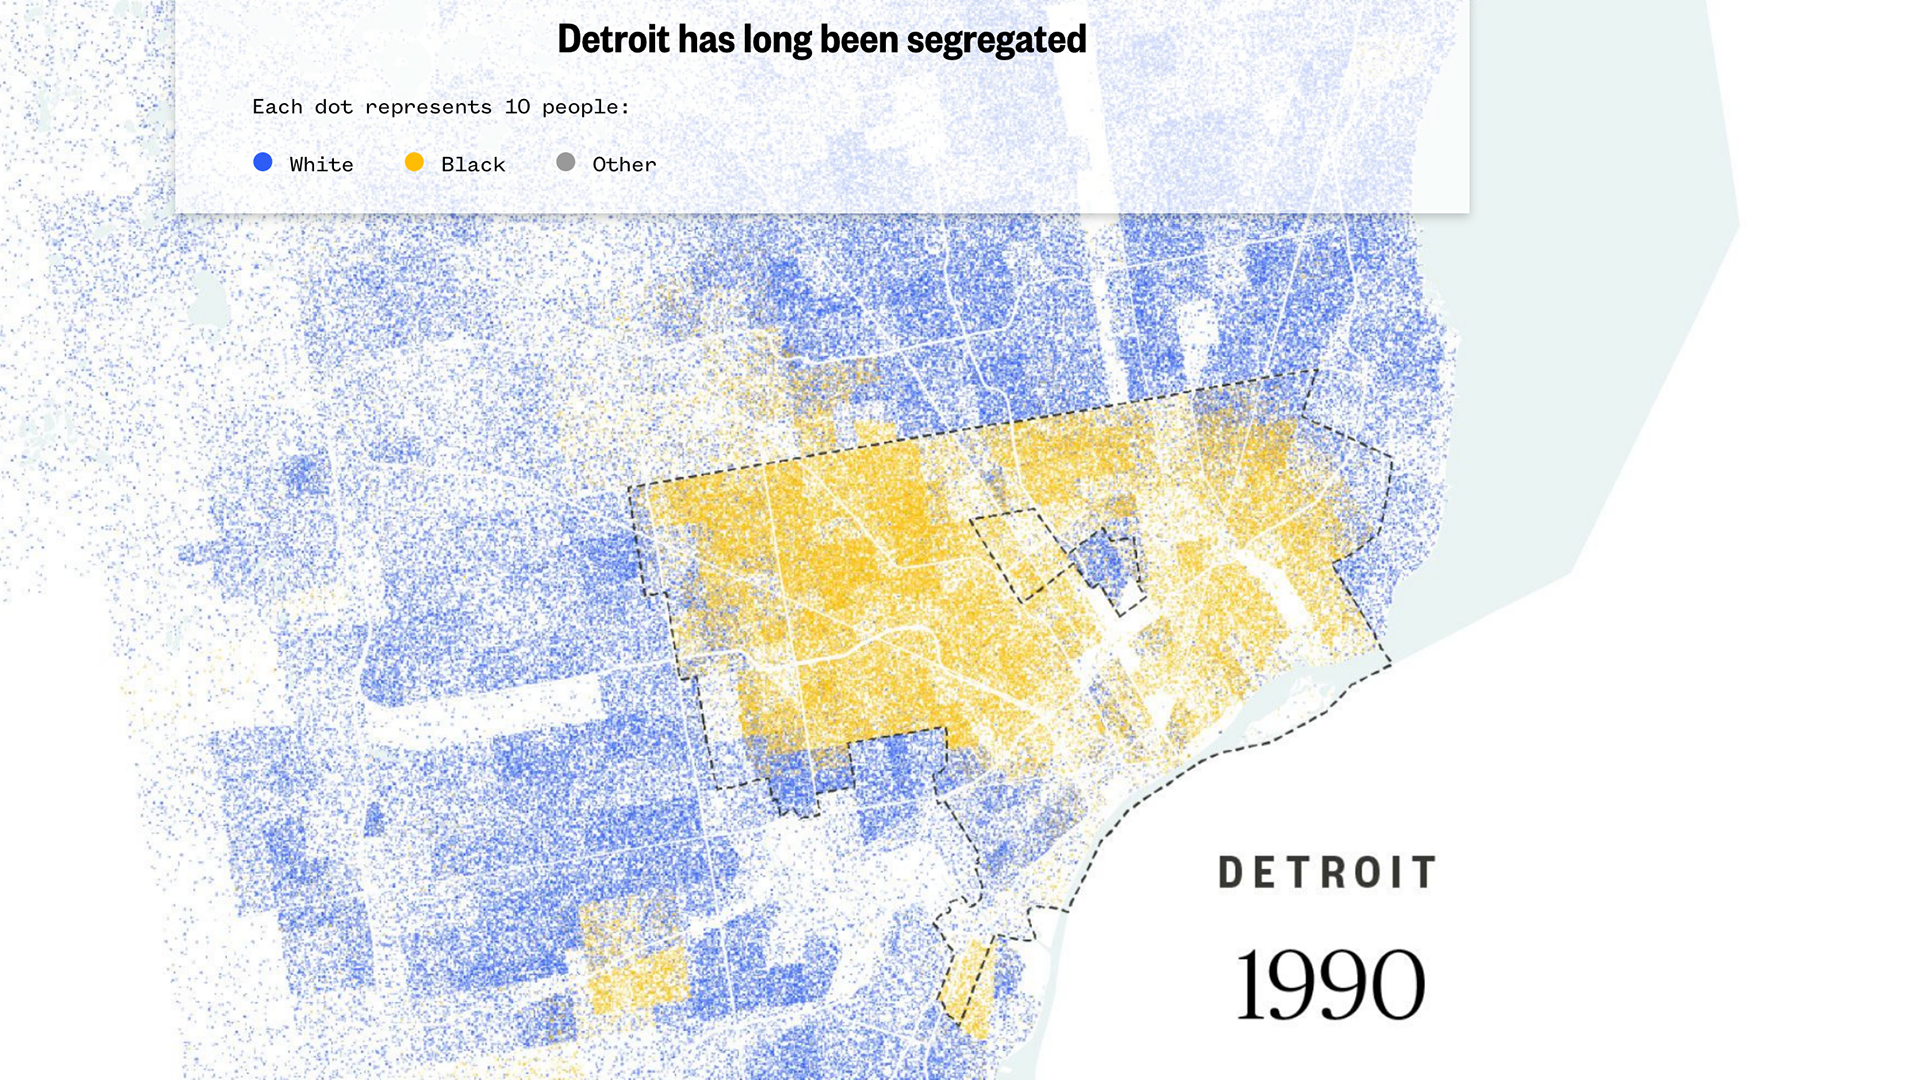
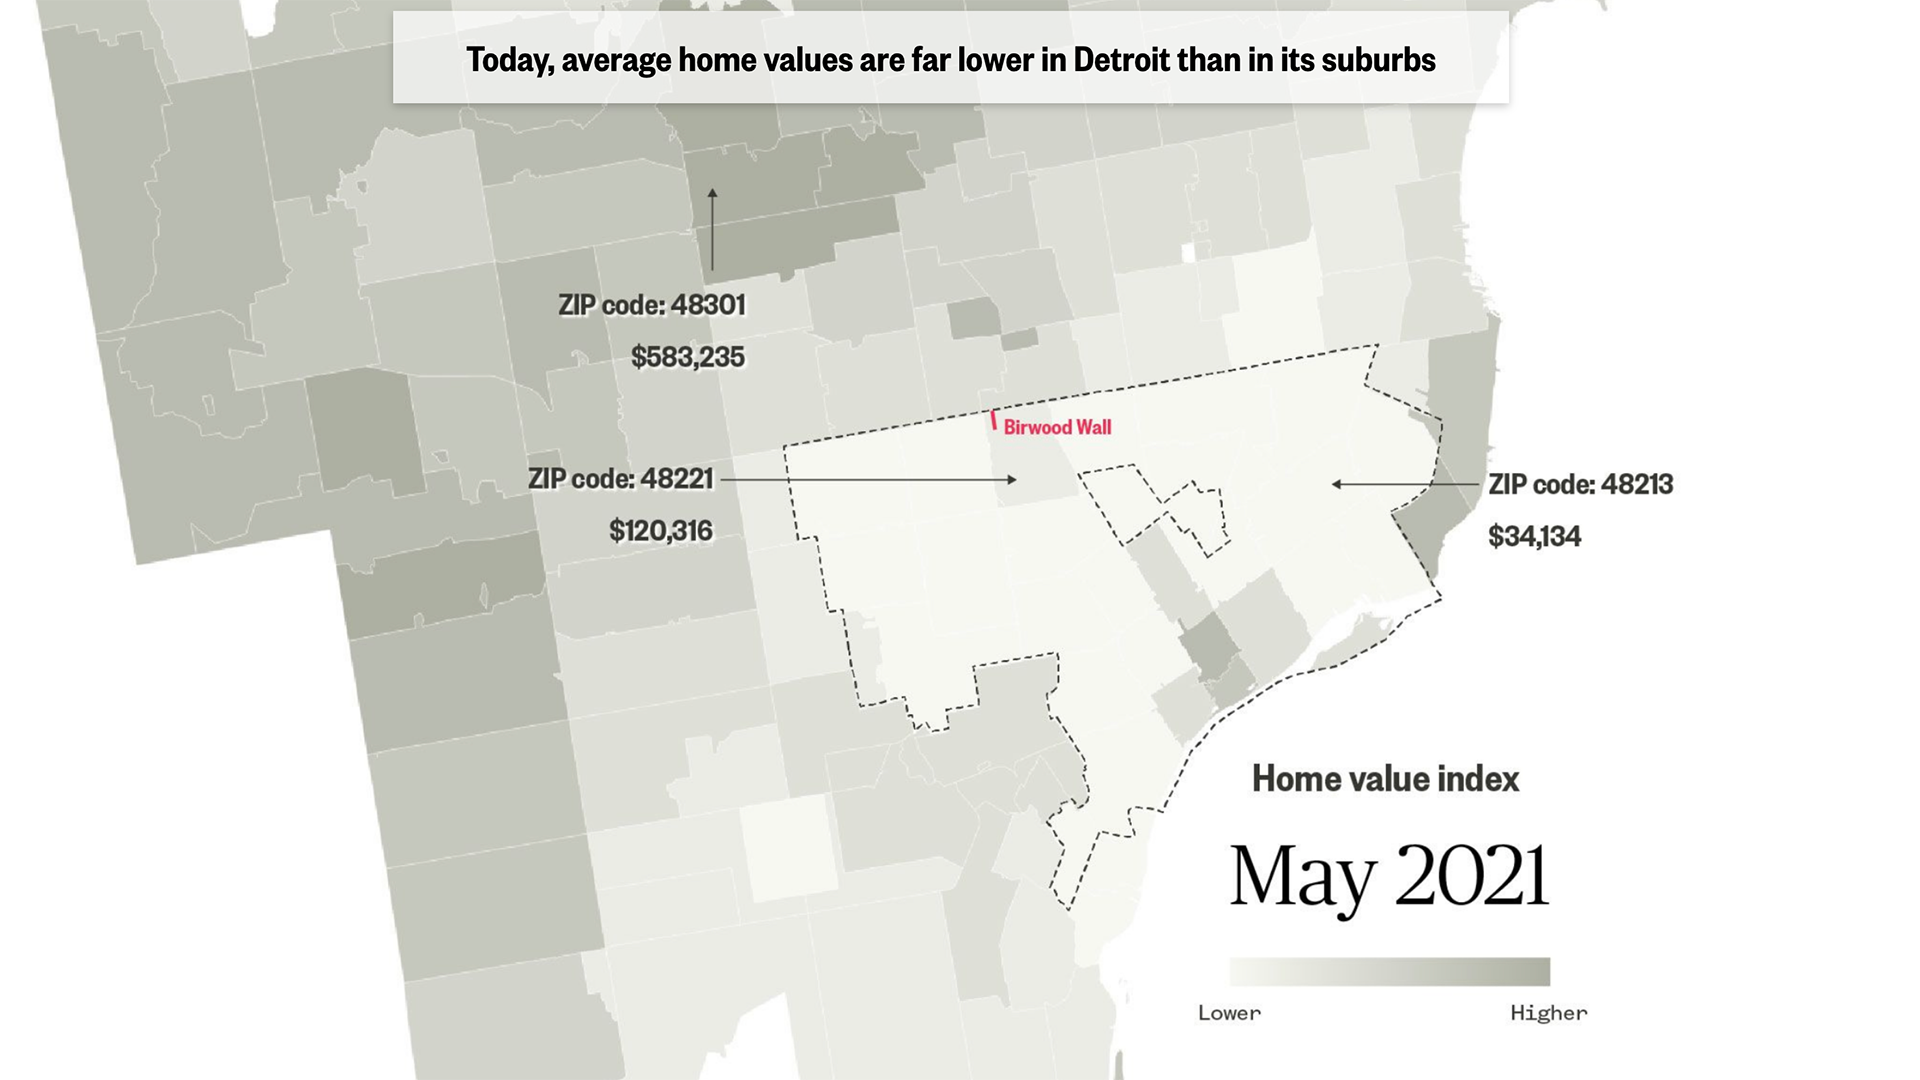
"Once we saw the housing prices and how they matched where people lived we were able to really see the visual effects of redlining all the way up to the present date."NBC News
Q: Tell us about your initial moodboard, wireframe, or prototype. How did things change throughout the process?
A: Our visual plan started in a Google doc, with a rough draft of each element, alongside with what each element meant to the story. Beside the addition of the animated map showing the wall there wasn’t much change to the plan.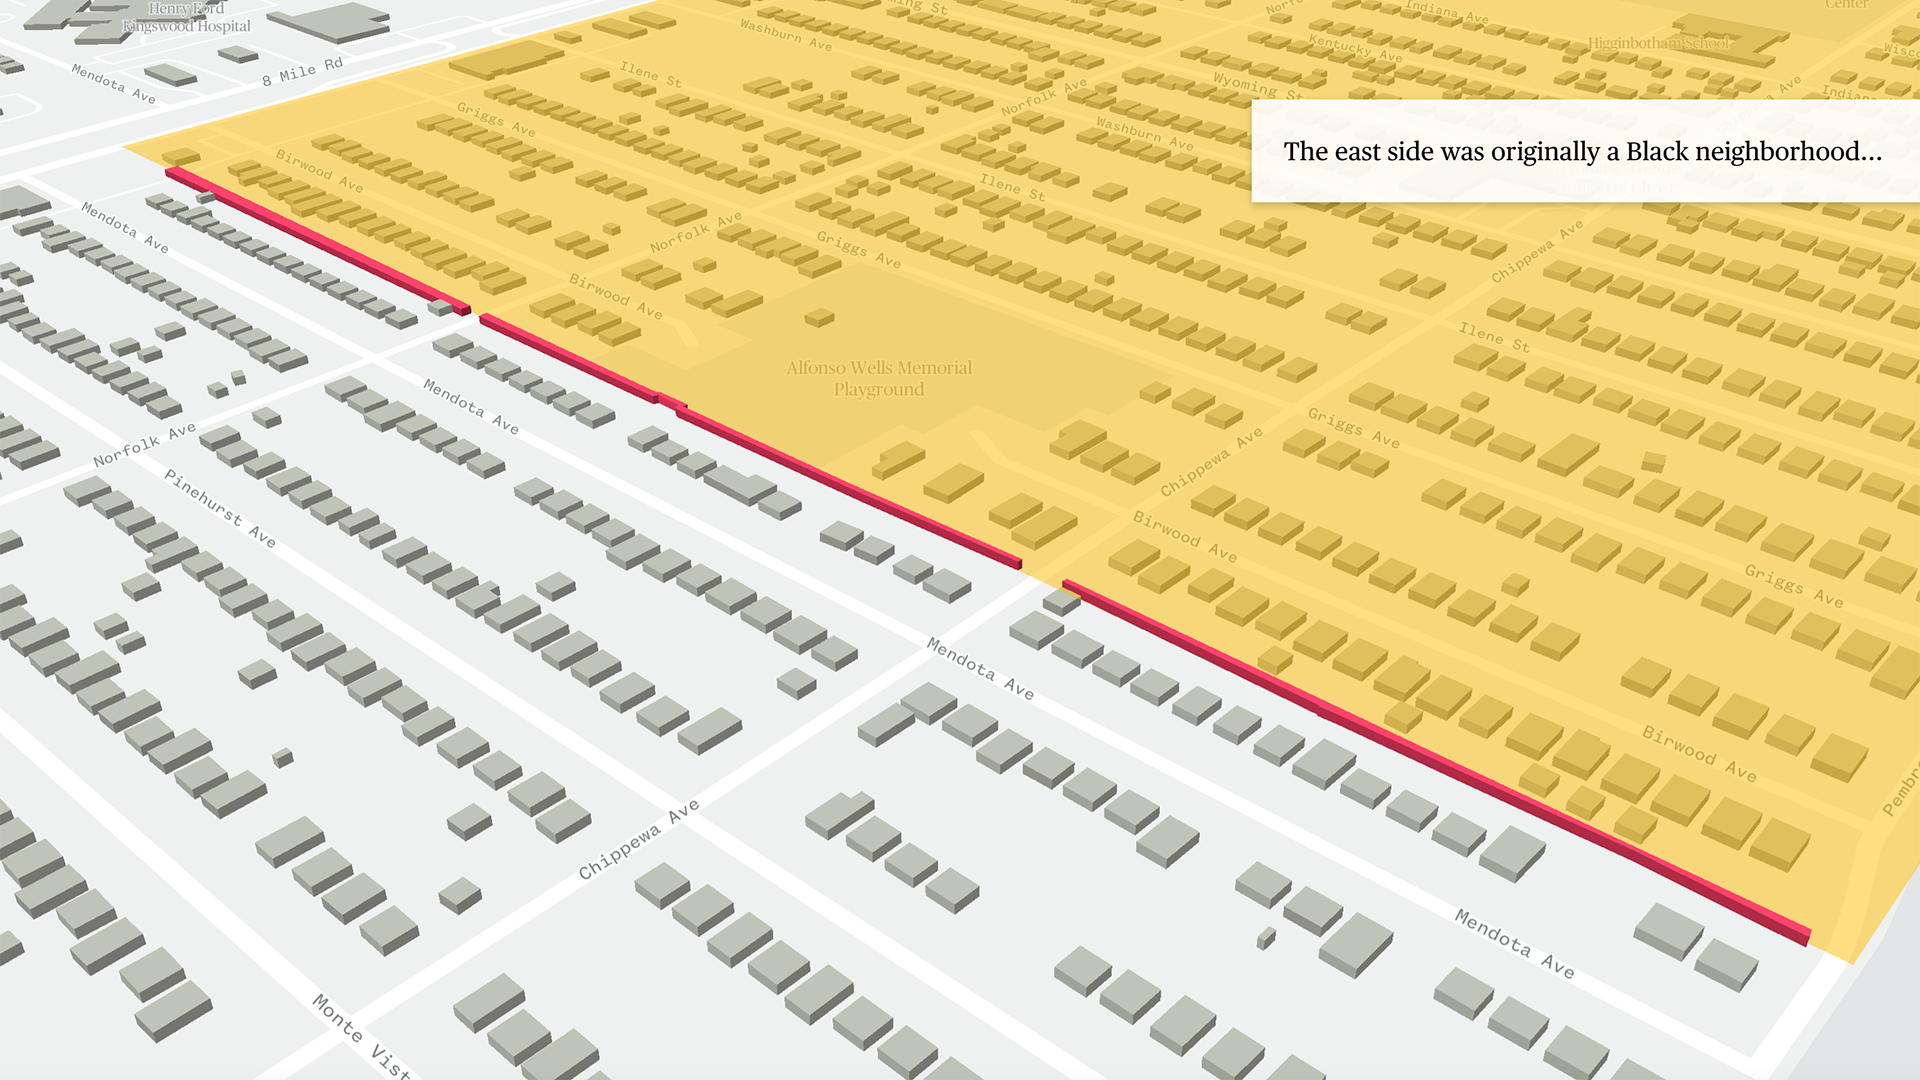
Q: What influenced your chosen technical approach, and how did it go beyond past methods?
A: We used the long-form article platform Shorthand to combine the multimedia assets that we created and obtained. One element that sets this project apart is the animated map we created using a range of unrelated tools, from Google Earth Pro to create the shape of the wall (based on information from our reporting) to Mapbox, the vendor who makes the tool we used to create the animation.When did you experience a breakthrough or an "a-ha" moment during this project?
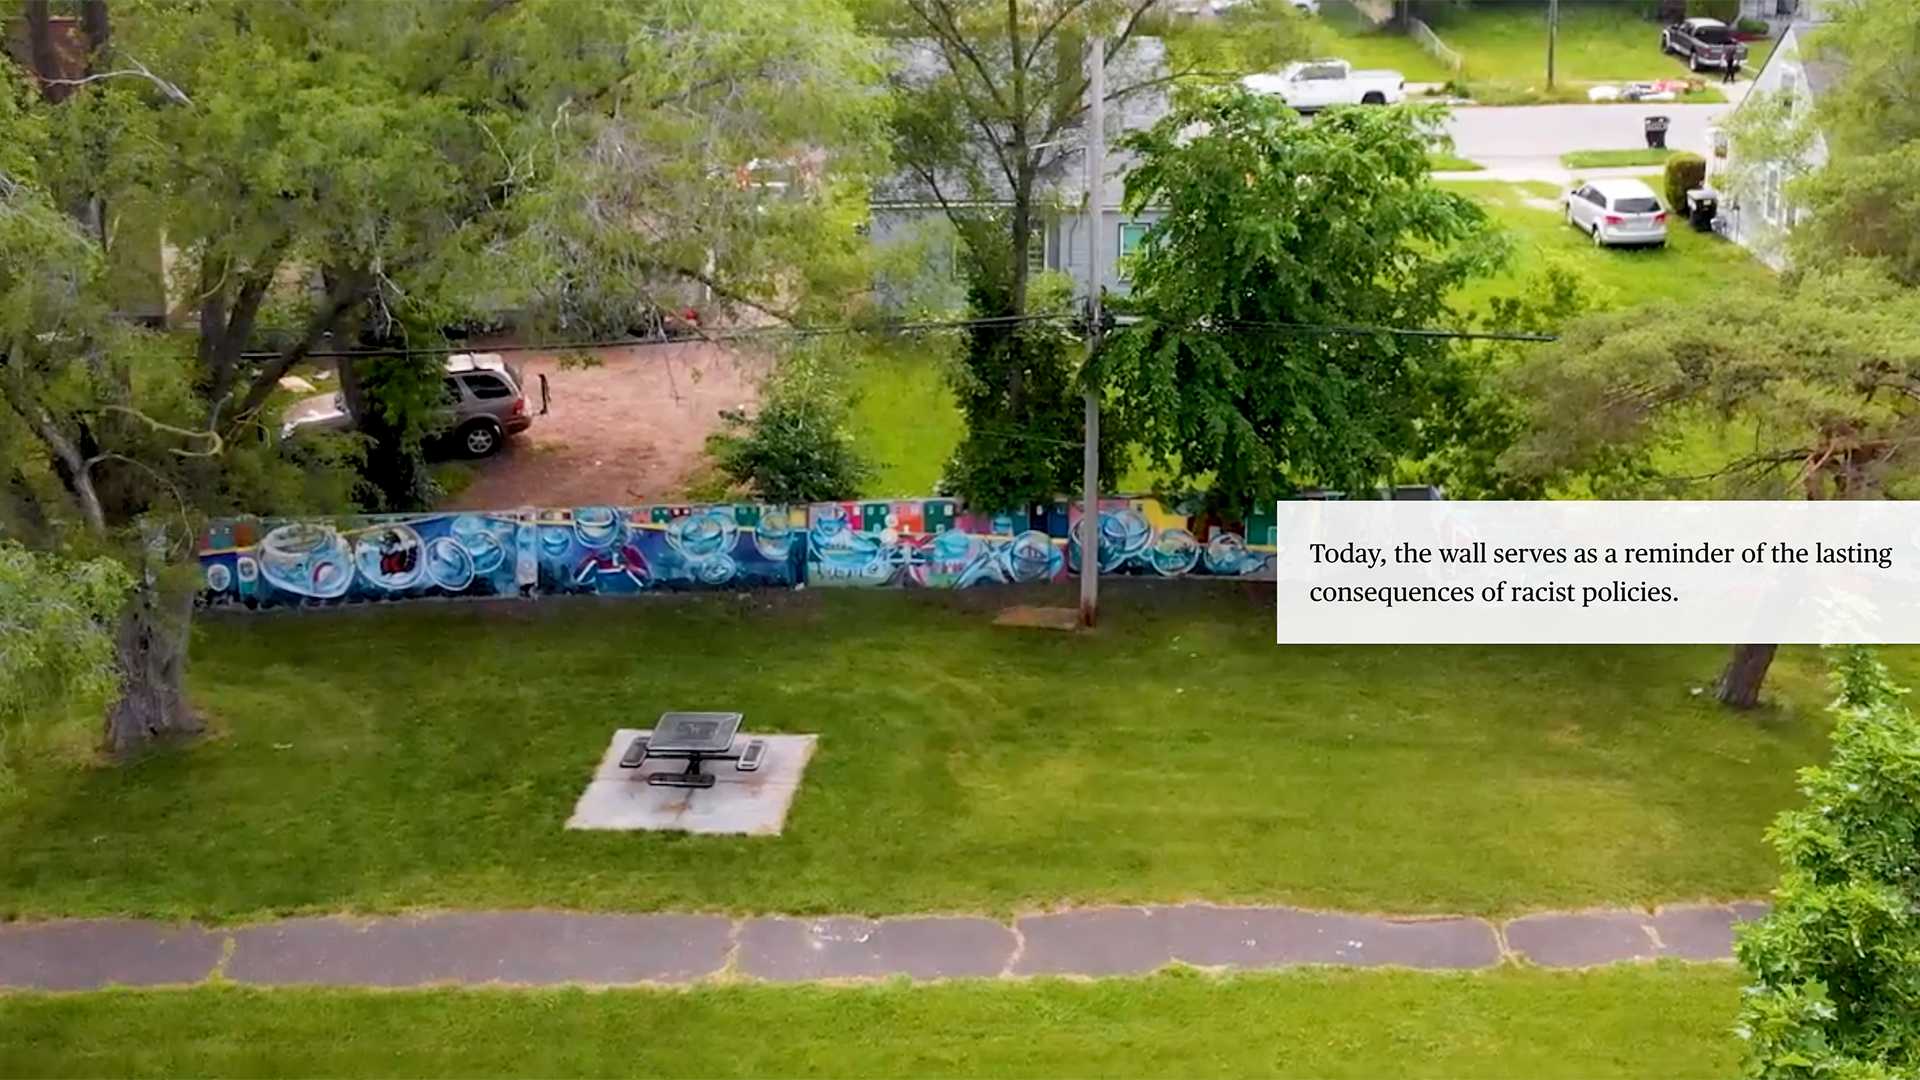
One: After we watched the drone footage we thought it would be great if there were an animation that could show readers what the wall looked like in 3D, which we created with a combination of Google Earth Pro and Mapbox. Another: Once we saw the housing prices and how they matched where people lived we were able to really see the visual effects of redlining all the way up to the present date.
Q: What web technologies, tools, and resources did you use to develop this?
A: We used Mapbox, Shorthand, Javascript, HTML, CSS, QGIS, Adobe Illustrator, Premiere, DJI drone, Google Earth Pro and an internal tool used to develop and publish web graphics.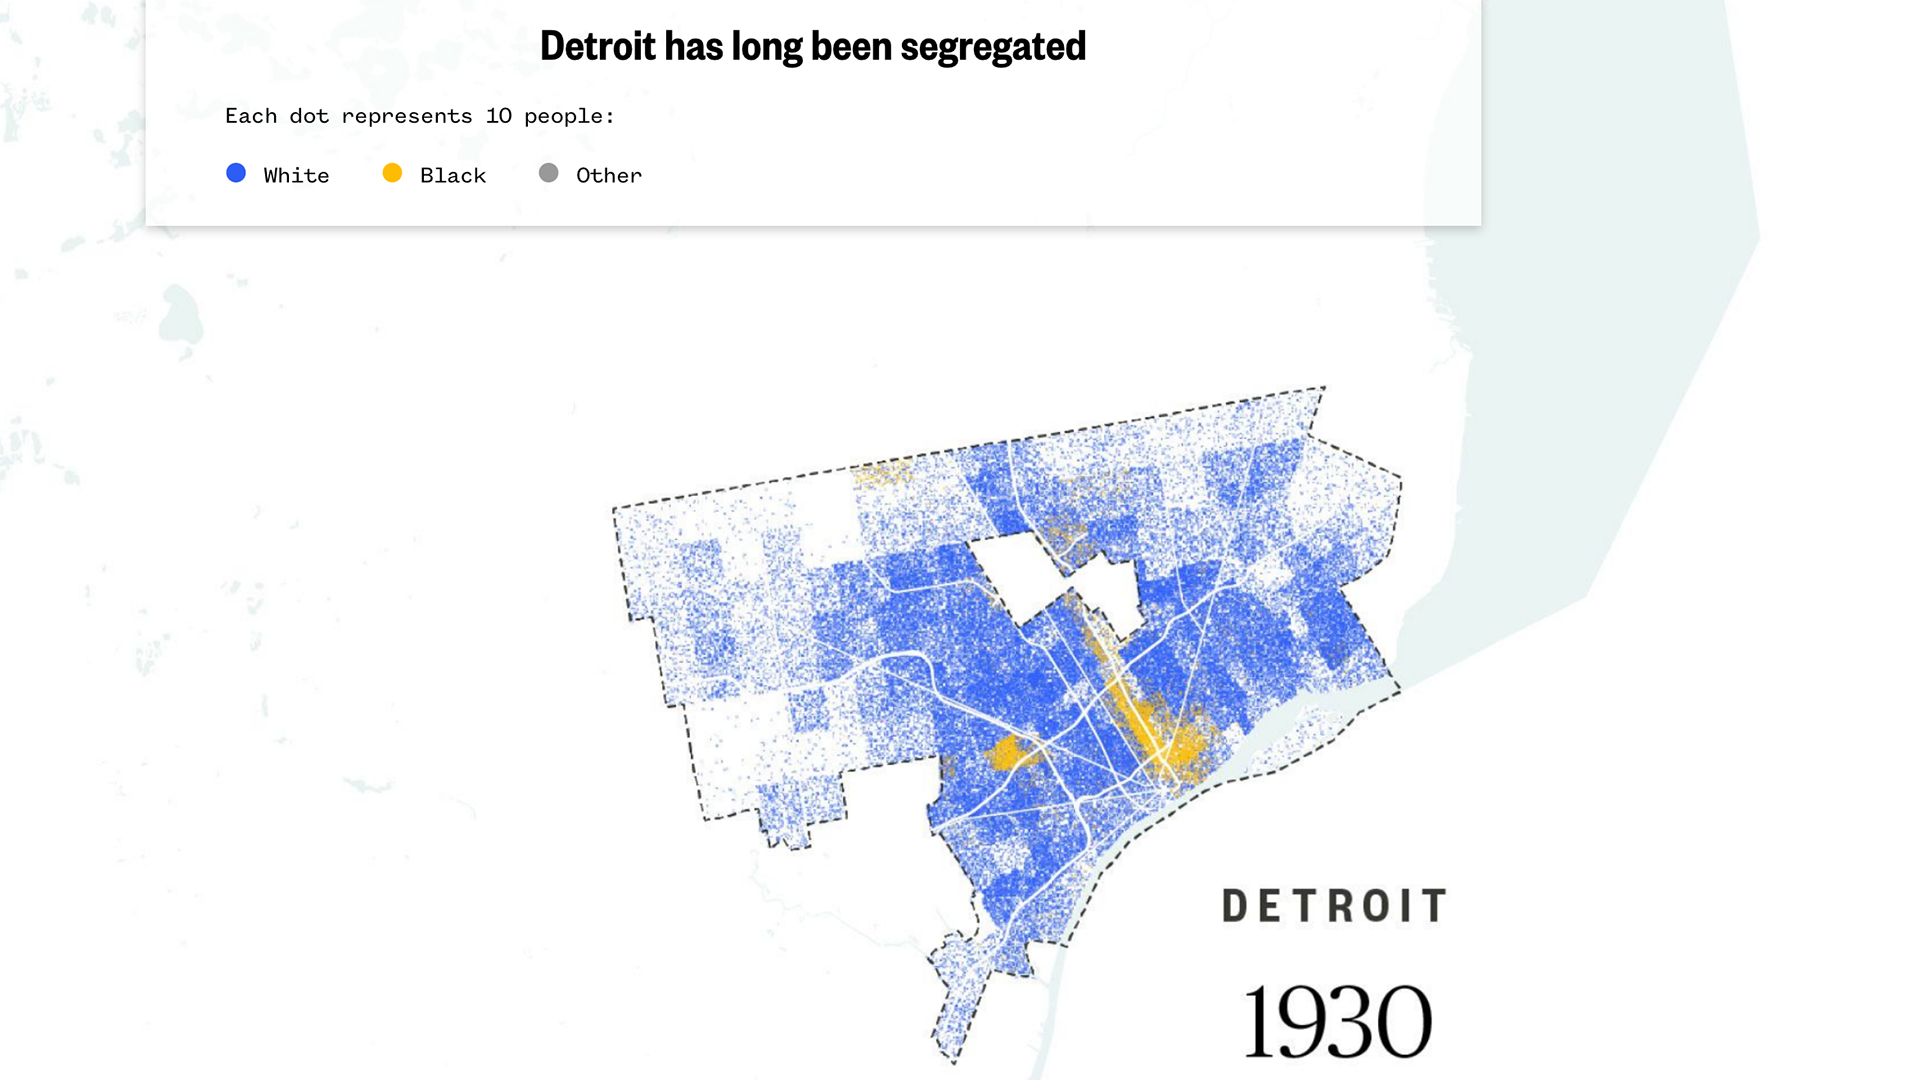
Q: How did you balance your own creative ideas and technical capabilities with a fair representation of the client’s brand?
A: We partnered with BridgeDetroit, a nonprofit local news company, on some of the interviews and writing. As far as the rest of the piece, it helps when you’re all working for the same organization and you’ve worked together before. We leveraged weekly check-ins on the visuals and production schedule to keep the project moving forward amid competing deadlines.