The interactive scrolling graphic developed on Canvas with d3 and ScrollMagic powerfully presented the data to clearly show the discrepancy between federal requirements and the actual treatment of transgender prisoners.- NBC News Team

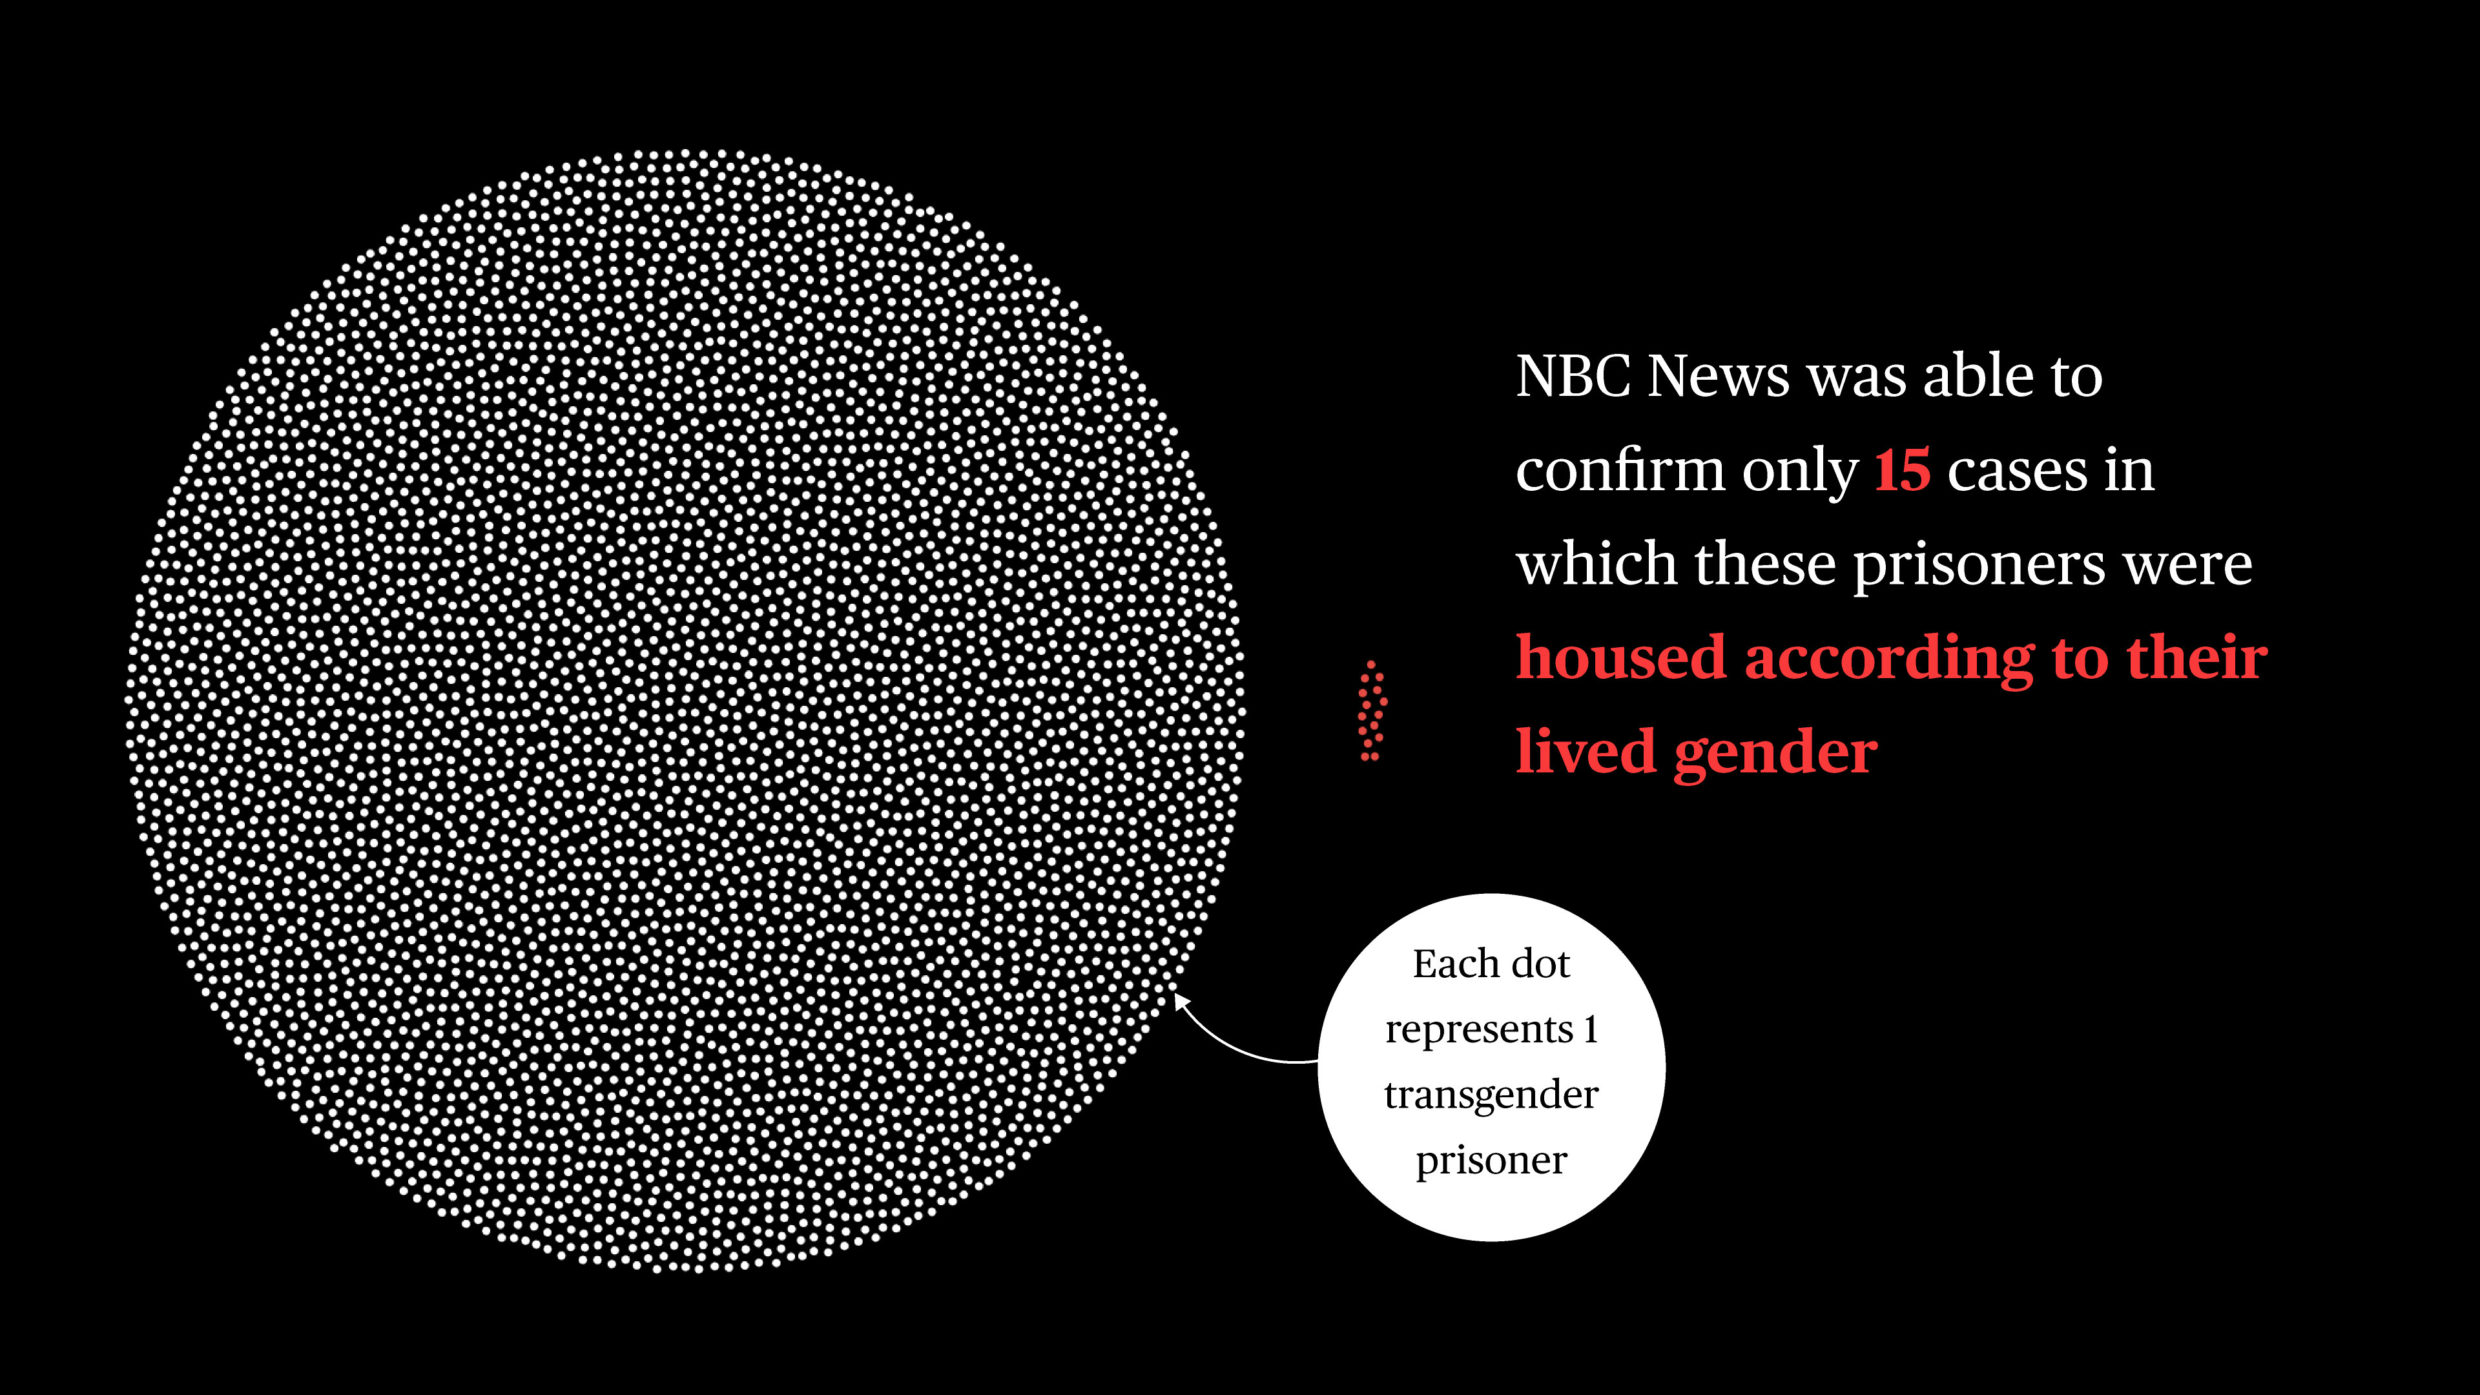
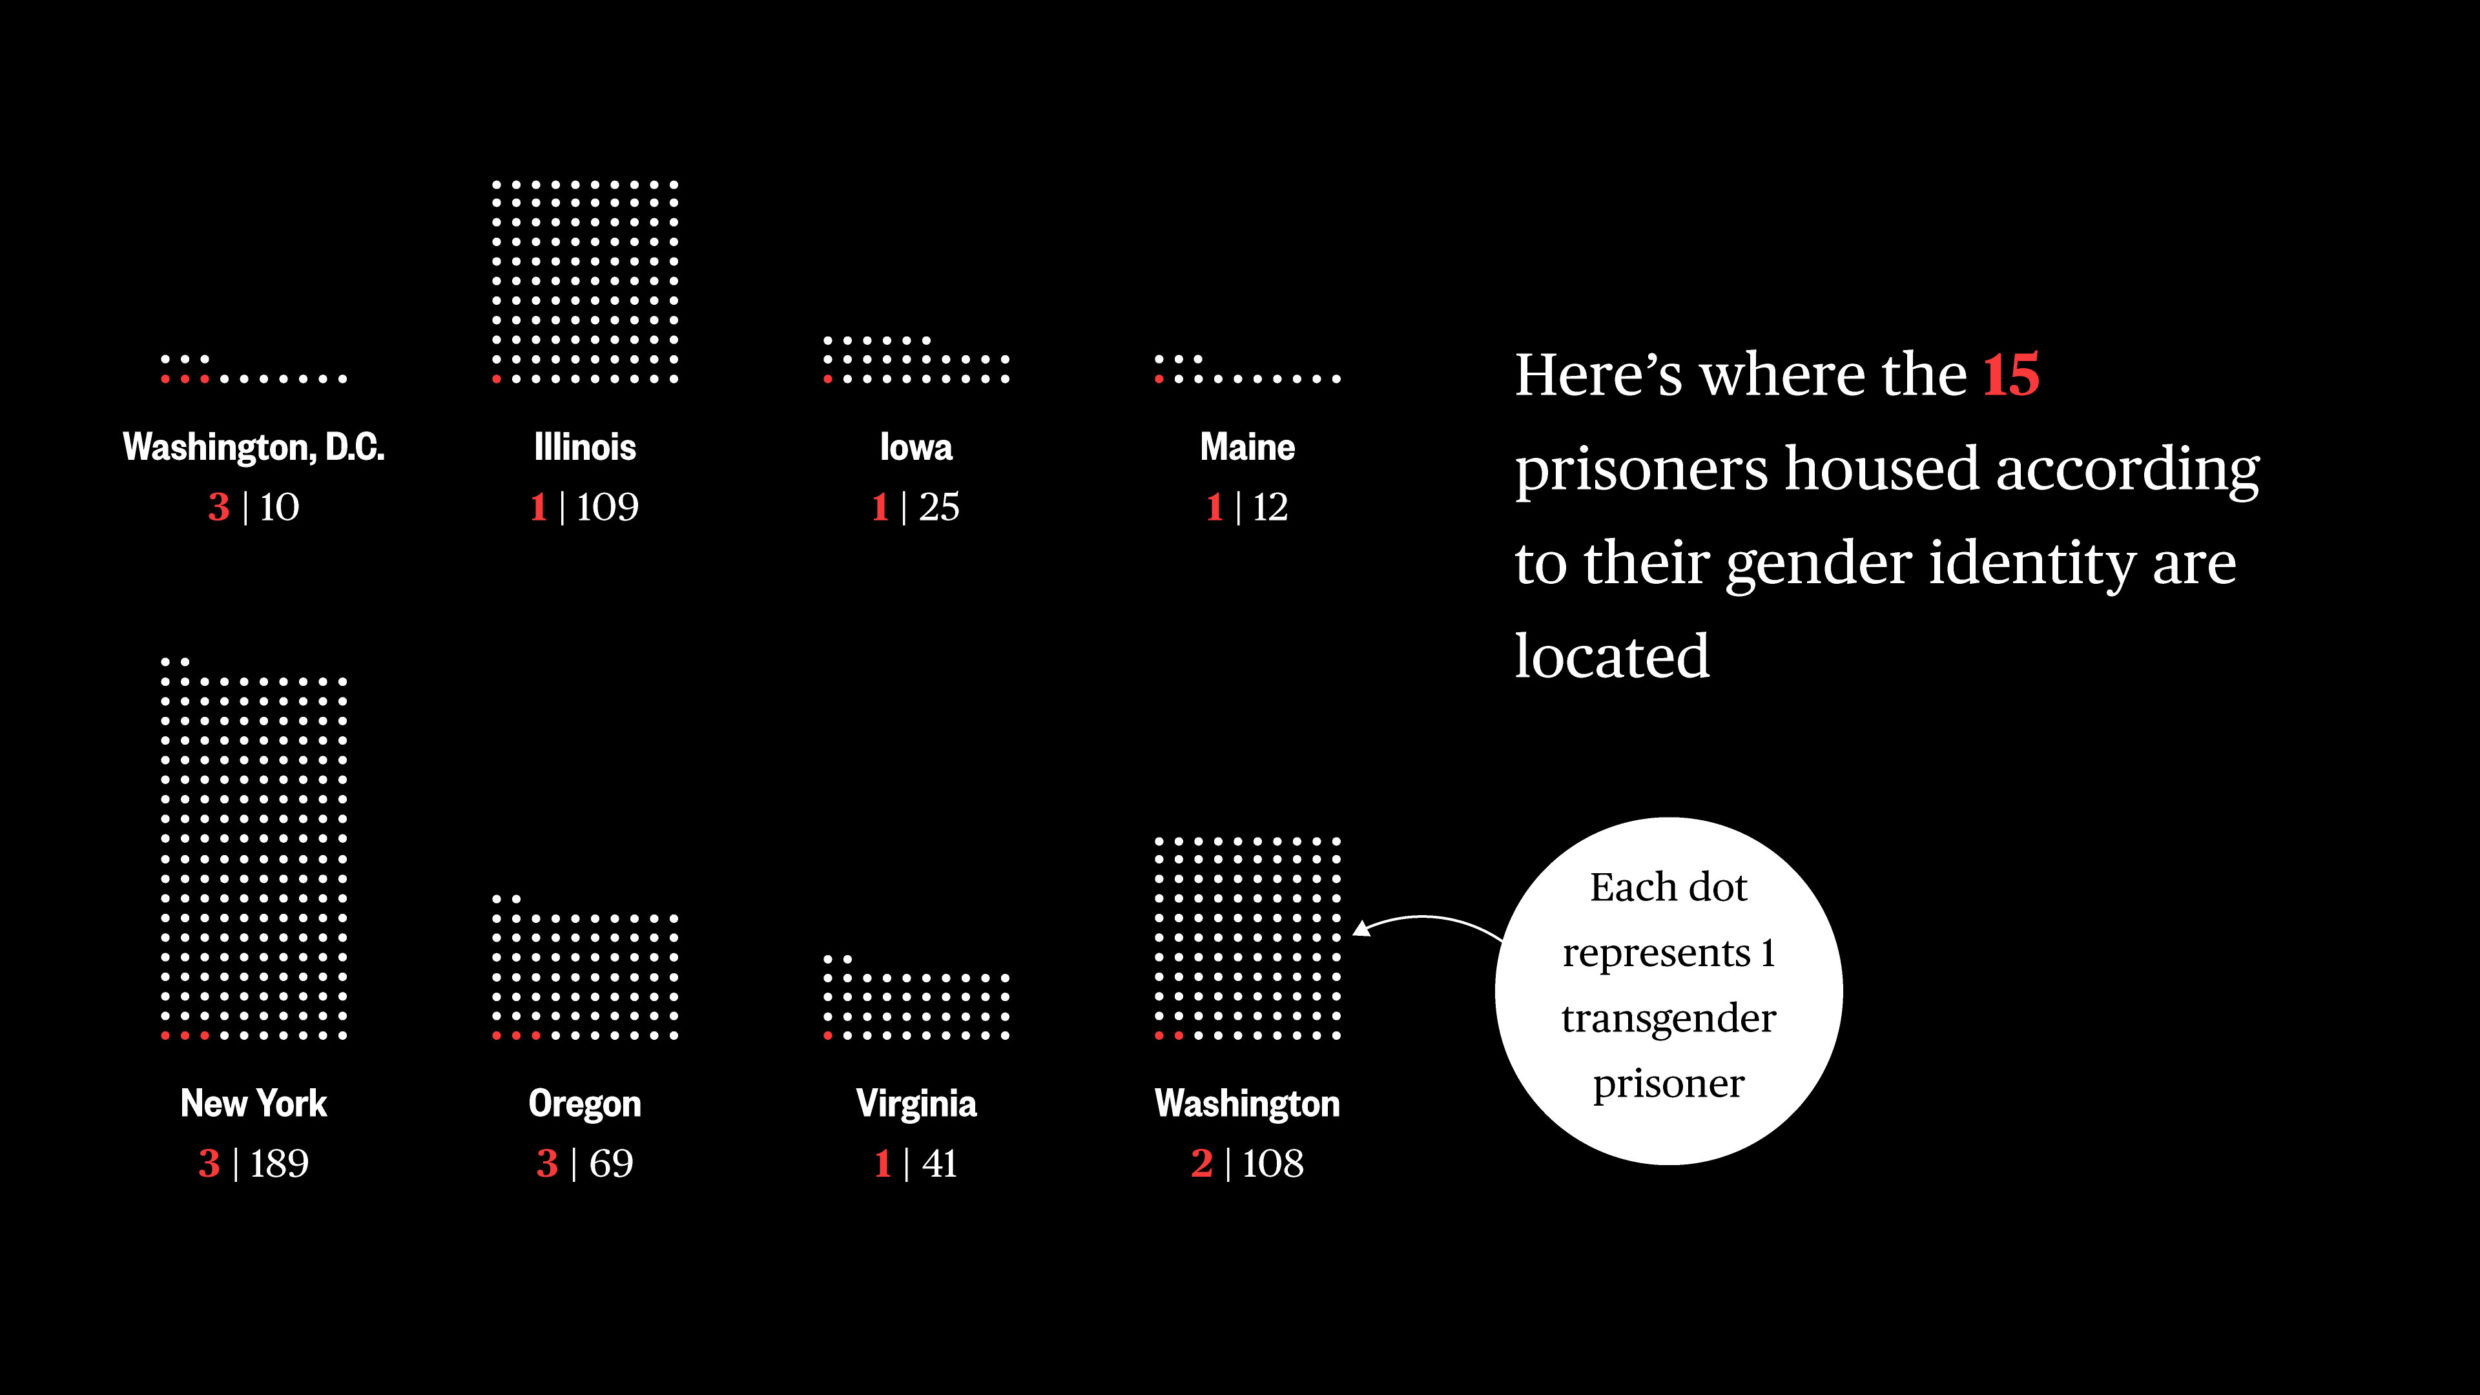
Q: Can you describe your project and the concept behind it? A: In a groundbreaking NBC News investigation, reporter Kate Sosin conducted the first national count of transgender state prisoners and the first survey of where they are housed. Sosin found that out of nearly 5,000 transgender state prisoners tracked in 45 states and Washington, D.C., only 15 were housed according to their lived gender — suggesting that states are violating a federal law designed to protect prisoners from sexual violence.

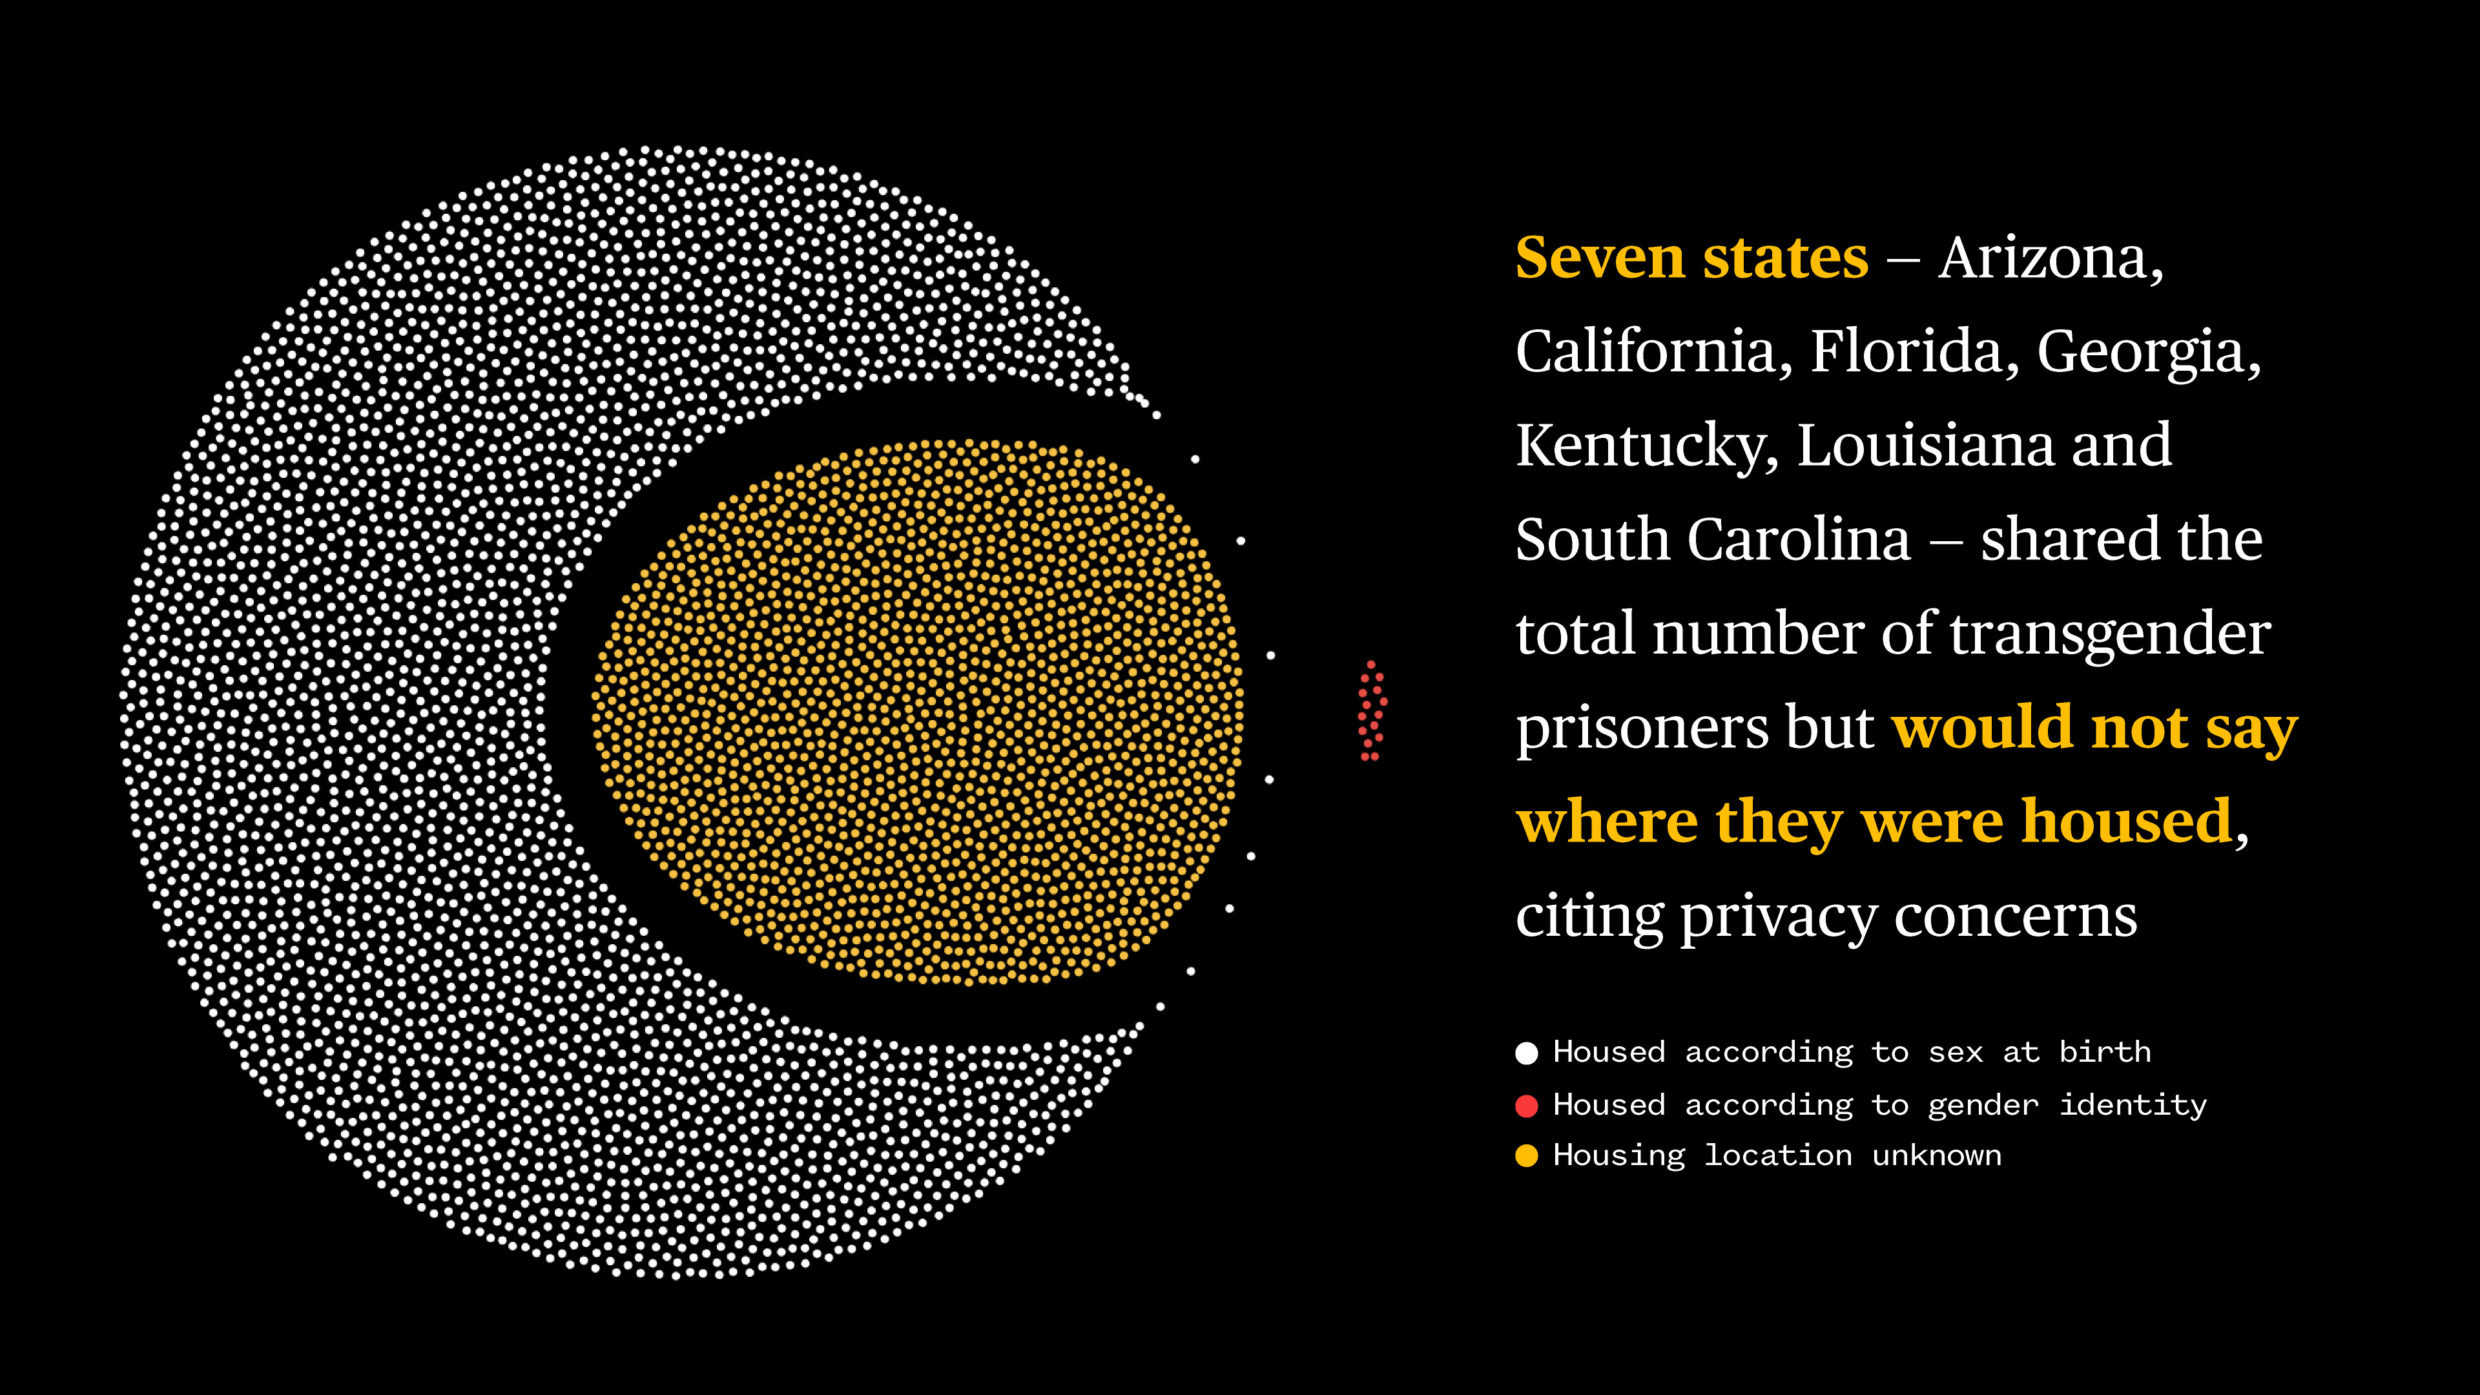
Q: What influenced your chosen technical approach, and how did it go beyond past methods? A: Each particle in the visual represents a person; in total that's nearly 5,000 dots. In order to map that out on the page with reasonable loading speed, the team tested the approach from drawing dots on svg by using d3.js force layout. However, the performance was not ideal so the team ended up writing with WebGL on canvas.

Q: What web technologies, tools, and resources did you use to develop this? A: The data source was based on Freedom of Information requests filed with all 50 states to conduct the first national count of transgender state prisoners and where they are housed. The team coded the page using HTML and CSS, and used JavaScript, d3.js library, and WebGL to write up functions to align all the dots which represent a prisoner. The project’s visualization began with sketches through Observable Notebook and d3.js.
When did you experience a breakthrough or an "a-ha" moment during this project?
In order to show a clear comparison between portions of unknown housed prisoners and housed according to gender identity, we wanted to calculate each dot's position based on its category instead of randomly assigning a position. With canvas, it’s hard to debug with regular console log and there's no way to assign a class name to each dot. The team ultimately combined d3 force layout type with WebGL to cluster dots based on the category.
Q: How did the final product meet or exceed your expectations? A: Sosin’s tenacious reporting exposed for the first time the true scope of the difficulty facing transgender prisoners — a population hidden from public view, whose stories are rarely told. The data Sosin collected in their investigation, which was shared widely by LGBTQ advocacy groups and political leaders, is essential to ensuring that their struggles are no longer ignored.
Q: Why is this an exciting time to create new digital experiences? How does your team fit into this? A: After collecting responses from states, Sosin worked with members of NBC News’ data journalism team to visualize the stark injustice facing transgender prisoners. The resulting interactive scrolling graphic developed on Canvas with d3 and ScrollMagic powerfully presented the data to clearly show the discrepancy between federal requirements and the actual treatment of transgender prisoners.

